The complexity of applications has increased because of new cloud technologies and new application architectures. Since organizations adopt and embrace the DevOps mindset, developers and IT operations are closer than ever. Developers are now part of the team operating the distributed systems.
Businesses must figure out how they know about system failures and need to have an understanding “what” is broken (symptom) and “why” (possible cause) something is broken.
Let’s talk about application performance management (APM) and enterprise observability. 🙂
Monitoring
It was around the year 2012 or 2013 when I had to introduce a new monitoring solution for a former employer who was a cloud service provider. I think Nagios was the state-of-the-art technology back then and I replaced it PRTG Network Monitor from Paessler.
When we onboarded a new customer infrastructure or application, the process was always the same. I had to define the metrics to collect and then put those metrics on a dashboard. It was very important to set alerts based on thresholds or conditions. Everyone knew back then that this approach wasn’t the best, but we didn’t have any other choice.

If an IP was not pingable or a specific port of a server or application was down for 60 seconds, an alert popped up and an e-mail had been sent to the IT helpdesk. And in the dashboard you could see sensors switching from a green to a red state.
To simplify the troubleshooting process and to have some a logical application view, I had to create some dependencies between sensors. This was probably the only way to create something like an application (dependency) mapping.
When users worked on a virtual desktop or on a Windows Terminal Server, we “measured” the user experience and application performance based on network latency and server resource usage based on CPU and RAM mostly.
Observability
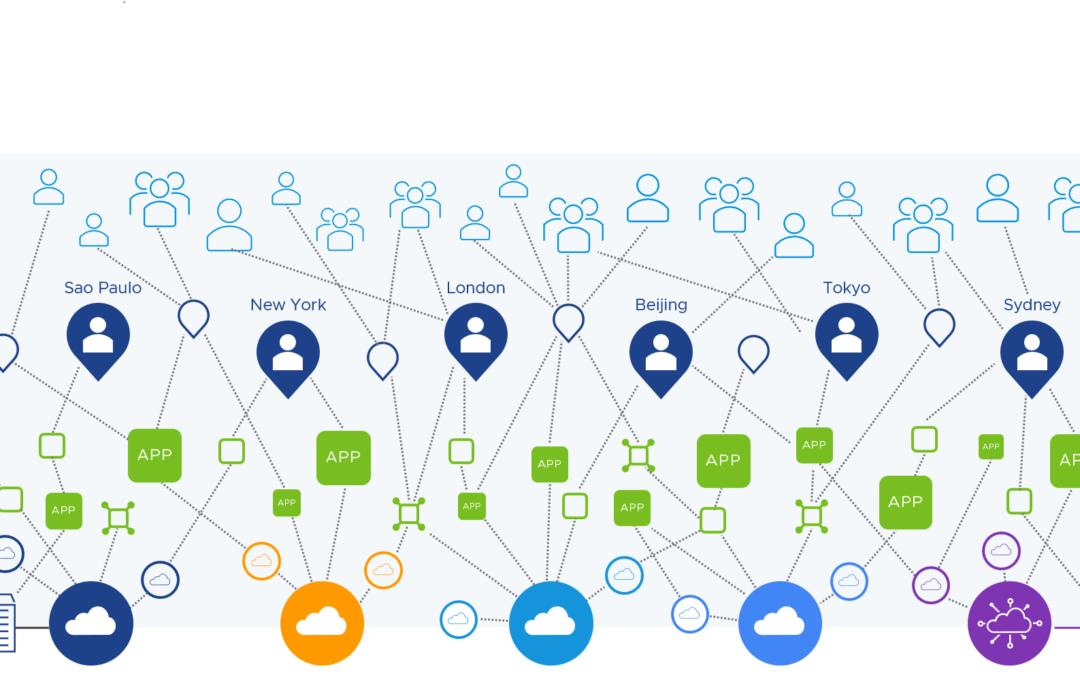
Observability enables you to drill down into the distributed services and systems (hardware components, containers, microservices) that make up an application.
Monitoring and observability are not the same thing. As described before, monitoring is the process of collection metrics and alerts that one can monitor the health and performance of components like network devices, databases, servers or VMs.
Observability helps you to understand complex architectures and interactions between elements in this architecture. It also allows you to troubleshoot performance issues, identify root causes for failures faster and helps you to optimize your cloud native infrastructure and applications.
In other words, observability can help you to speed up mean time to detection (MTTD) and mean time to resolution (MTTR) for infrastructure and application failures.
There are three golden telemetry signals to achieve observability (source):
- Logs: Logs are the abiding records of discrete events that can identify unpredictable behavior in a system and provide insight into what changed in the system’s behavior when things went wrong. It’s highly recommended to ingest logs in a structured way, such as in JSON format so that log visualization systems can auto-index and make logs easily queryable.
- Metrics: Metrics are considered as the foundations of monitoring. They are the measurements or simply the counts that are aggregated over a period of time. Metrics will tell you how much of the total amount of memory is used by a method, or how many requests a service handles per second.
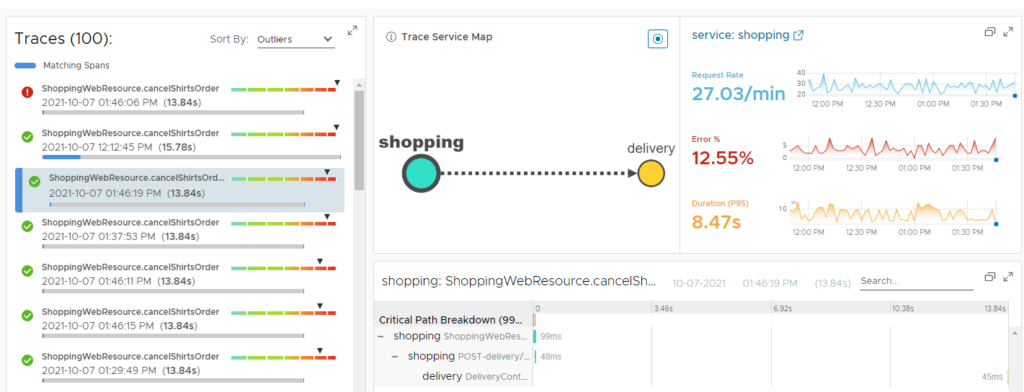
- Traces: A single trace displays the operation as it moves from one node to another in a distributed system for an individual transaction or request. Traces enable you to dig into the details of particular requests to understand which components cause system errors, monitor flow through the modules, and discover the bottlenecks in the performance of the system.
When using observability during app development, it can also improve the developer experience and productivity.
Tanzu Observability Services
The VMware Tanzu portfolio currently has four different editions:
Different Tanzu Observability services are available for different components and Tanzu editions.
Tanzu Standard Observability
Tanzu Standard includes the leading open-source projects Prometheus and Grafana for platform monitoring (and Fluent Bit for log forwarding).
Tanzu Kubernetes Grid provides monitoring with the open-source Prometheus and Grafana services. You deploy these services on your cluster and can then take advantage of Grafana visualizations and dashboards. As part of the integration, you can set up Alertmanager to send alerts to Slack or use custom Webhooks alert notifications.

Tanzu Standard Observability is comprised of:
- Fluent Bit is an open-source log processor and forwarder which allows you to collect any data like metrics and logs from different sources, enrich them with filters and send them to multiple destinations. It’s the preferred choice for containerized environments like Kubernetes.
- Grafana is a multi-platform open-source analytics and interactive visualization web application. It provides charts, graphs, and alerts for the web when connected to supported data sources.
- Prometheus is a free software application used for event monitoring and alerting. It records real-time metrics in a time series database built using a HTTP pull model, with flexible queries and real-time alerting.
Note: VMware only provides advisory (best effort) guidance on Prometheus and Grafana for use with Tanzu Kubernetes Grid. The installation, configuration and upgrades are beyond the current scope of VMware’s advisory support.
Tanzu Advanced Observability
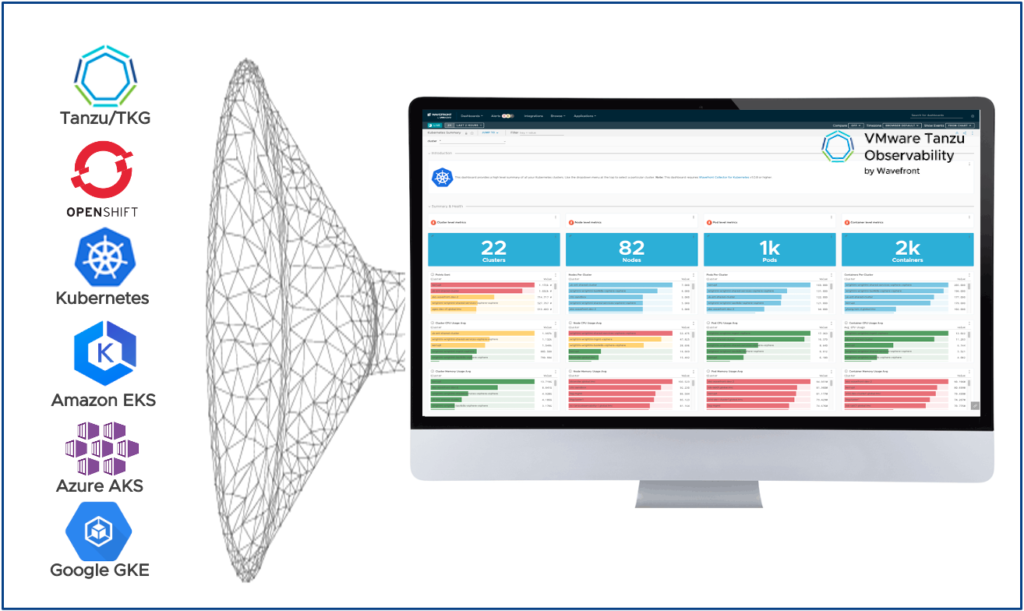
In May 2017 VMware acquired Wavefront which is now part of the Tanzu portfolio and called “Tanzu Observability” (TO).
TO is a SaaS-based metrics monitoring and analytics platform that handles enterprise-scale requirements of modern cloud native application.
Compared to the Grafana/Prometheus, one would say that Tanzu Observability is a true enterprise-grade observability platform. According to the GigaOm Cloud Observability Report VMware Tanzu Observability is one of the strong leaders among Dynatrace and Splunk just to name a few.
Tanzu Observability is best suited for large organization and provides a consumption-based pricing that is based on the rate at which you send metric data to Tanzu Observability during the course of each month. This gives you the flexibility to start with any size want and scale up/down as needed. It’s not dependent on number of hosts or the number of users.

Tanzu Observability allows you to collect data from different sources and provides integrations to over 250 technologies including different public clouds, web application and services, big data frameworks, data stores, other monitoring tools, operating systems / hosts, and many more.

While data retention with Prometheus is limited to a maximum of 14 days, VMware allows you to send Prometheus data to Tanzu Observability for long-term data retention (up to 18 months at full granularity).
Just announced at VMworld 2021, VMware has added artificial intelligence and machine learning (AI/ML) root cause capabilities…

…and created an integration between Tanzu Observability and vRealize Operations Cloud.
Through this integration, developers and SREs can now view vRealize Operations Cloud metrics alongside all the metrics, histograms, and traces collected by Tanzu Observability from other sources for a more holistic view of business-critical applications and infrastructure.
If you are attending VMworld, check out the sessions below to learn more about Tanzu Observability.
- APP1308: Observability for Modern Application and Kubernetes Environments
- APP2648: Implement Observability for Kubernetes Clusters and Workloads in Minutes
- VI2630: Best Practices and Reference Framework for Implementing Observability
- UX2551: Move from Traditional Monitoring to Observability and SRE – Design Studio
- VMTN2810: Lost in Containers? Enhance Observability with Actionable Visualization
- 2965: Kubernetes Cluster Operations, Monitoring and Observability
- 2957: Build a Data Analytics Platform in Minutes Using Deployment Blueprints
- APP2677: Meet the Experts: VMware Tanzu Observability by Wavefront
- VMTN3230: Observe Application internals Holistically
- VI1448: Take a Modern Approach to Achieve Application Resiliency
- APP1319: Transforming Customer Experiences with VMware’s App Modernization Platform
Integration with other Tanzu Products
Tanzu Observability is fully integrated within the Tanzu family with OOTB integrations with:
- Tanzu Kubernetes Grid
- Tanzu Mission Control
- Tanzu Application Service
- Spring
- Tanzu Application Catalog
Kubernetes Monitoring in vRealize Operations
Tanzu Observability provides “Kubernetes Observability” and OOTB integrations with RedHat OpenShift, Azure Kubernetes Service (AKS), Amazon EKS and Google GKE for example.
vRealize Operations (vROps) is also able to monitor multiple Kubernetes environments like VMware Tanzu Kubernetes Grid, RedHat OpenShift, Amazon EKS, Azure AKS or Google GKE. That is made possible with the vROps Management Pack for Kubernetes.
Using vRealize Operations Management Pack for Kubernetes (needs vROps 8.1 or later), you can monitor, troubleshoot, and optimize the capacity management for Kubernetes clusters. Below some of the additional capabilities that this management pack delivers:
- Auto-discovery of Tanzu Kubernetes Grid (TKG) or Tanzu Mission Control (TMC) Kubernetes clusters.
- Complete visualization of Kubernetes cluster topology, including namespaces, clusters, replica sets, nodes, pods, and containers.
- Performance monitoring for Kubernetes clusters.
- Out-of-the-box dashboards for Kubernetes constructs, which include inventory and configuration.
- Multiple alerts to monitor the Kubernetes clusters.
- Mapping Kubernetes nodes with virtual machine objects.
- Report generation for capacity, configuration, and inventory metrics for clusters or pods.

Note: Kubernetes monitoring is available in vRealize Operations Advanced.
There is also a Prometheus integration, that enables vRealize Operations Manager to retrieve metrics directly from Prometheus:

Note: vRealize Operations can also integrate with your existing application performance management systems. vROps offers integrations with App Dynamics, DataDog, Dynatrace and New Relic.
Conclusion
There are different options available within the VMware Tanzu and vRealize when it comes to Kubernetes operations, monitoring and observability.
Depending on your current needs and toolset you’ll have different options and integration possibilities.
VMware’s portfolio gives you the choice to use open-source software like Grafana/Prometheus, leverage an existing vRealize Operations deployment or to get an enterprise-grade observability and analytics platform like Tanzu Observability.
If you are looking for and end-to-end monitoring stack aka 360-degree visibility for your K8s environments and clouds, VMware Tanzu and the vRealize Suite give you the following products:
- Applications – Tanzu Observability
- Kubernetes Cluster – Tanzu Observability, vRealize Operations, vRealize Network Insight, vRealize Log Insight
- Network Layer – vRealize Operations, vRealize Network Insight, vRealize Log Insight
- Virtualization Layer – vRealize Operations, vRealize Network Insight, vRealize Log Insight