DevSecOps with VMware Tanzu – Intrinsic Security for a Modern Application Supply Chain

DevSecOps with VMware Tanzu – Intrinsic Security for a Modern Application Supply Chain

Intrinsic security is something we heard a lot in the past from VMware and it was mostly used to describe the strategy and capabilities behind the Carbon Black portfolio (EDR) that is complemented with the advanced threat prevention from NSX (NDR), that form together the VMware XDR vision.

I see similarities between intrinsic security and workout I am doing in the gym. My goal is to build more strength and power, and to become healthier in general. For additional muscle gain benefits and to be more time efficient, I have chosen compound exercises. I am not a fan of single muscle group exercises, which involve isolation exercises. Our body has a lot of joints for different movements, and I think it’s just natural if you use multiple muscle groups and joints during a specific exercise.

Therefore, when you perform compound exercises, you involve different muscles to complete the movement. This improves your intermuscular coordination of your muscles. In addition, as everyone would tell you, these exercises improve your core strength and they let your body become a single unit.

While doing weight training, it is very important to use the proper technique and equipment. Otherwise, the risk for injuries and vulnerabilities increases.

This is what intrinsic security means for me! And I think this is very much relevant to understand when talking about DevSecOps.

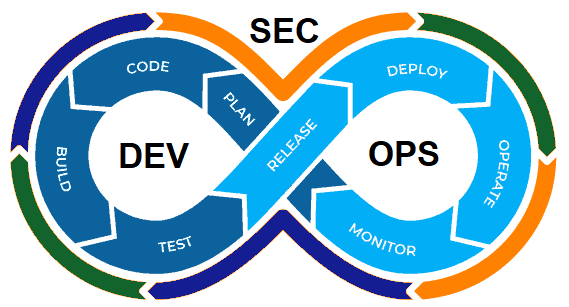
Understanding DevSecOps

For VMware, talking to developers and talking about DevOps started in 2019 when they presented VMware Tanzu the first time at VMworld. The ideas and innovation behind the name “Tanzu” should bring developers and IT operators closer together for collaboration.

DevOps is the combination of different practices, tools and philosophies that should help an organization to deliver applications and services at a higher pace. In the example above it would mean, that application developers and operations teams are not working isolated in silos anymore, they become one team, a single unit. But technology plays very important role to support the success of the new mindset and culture!

DevOps is about efficiency and the automation of manual tasks or processes. You want to become fast, flexible and efficient. When you put security in the center of this, then we start talking about DevSecOps. You want to know if one of your muscles or parts of the body become weak (defect) or vulnerable.

Tanzu DevSecOps Flow

Depending on where you are right now on this application modernization journey, doing DevSecOps could mean a huge cultural and fundamental change to how you develop applications and do IT operations.

For me, DevSecOps is not about bringing security tools together from different teams and technologies. If DevOps and DevSecOps mean that you must change your mindset, then it is maybe also about time to consider the importance of new technology choices.

If DevSecOps means that you put security in the center of a DevOps- or container-centric environment, then security must become an intrinsic part of a modern application supply chain.

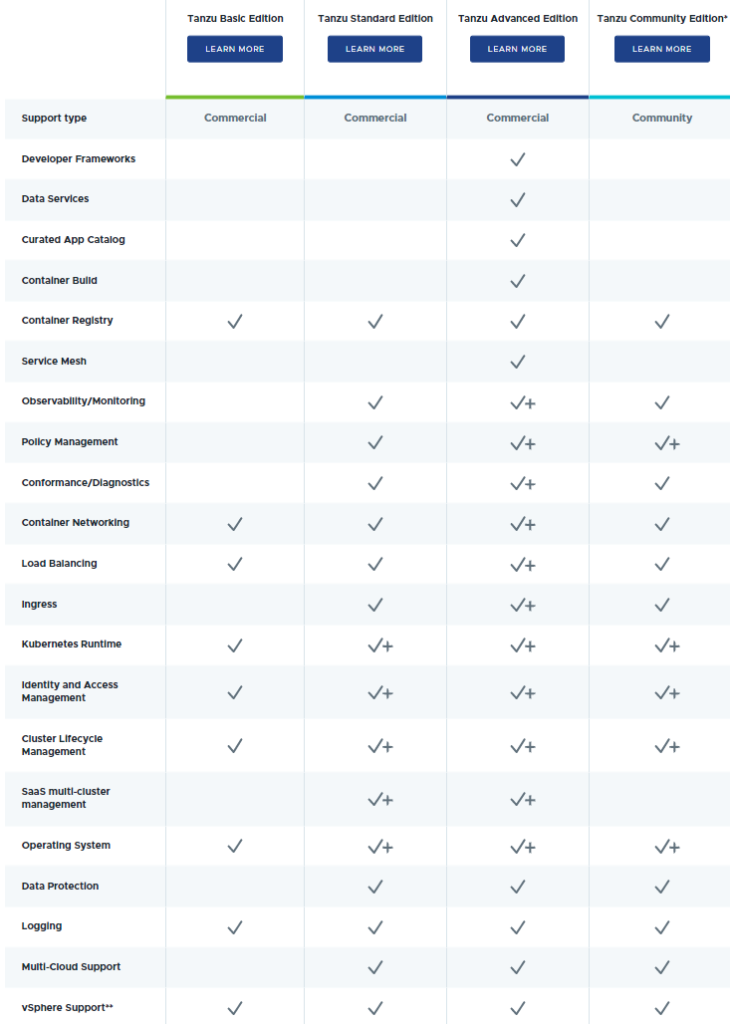
The VMware Tanzu portfolio has a lot of products and services to bring developers, operations and security teams together.

Where do we start? We need to “shift left” and this means we need to integrate security already early in the application lifecycle.

Code – Spring Framework

Before you can deliver an application to your customer, you need to develop it, you need to code. Application frameworks are a very effective approach for developing more secure and optimized applications.

Frameworks help to write code faster and more efficient. Not only does a framework can save your developers a lot of coding effort, but it also comes with pre-defined templates. They incorporate best practices and help you simplifying the overall application architecture.

Why is this important? To achieve better security or a more secure cloud native application, it makes sense to standardize and automate. Automation is key for security. Standardization makes it easier to understand or reuse code. You can write all the code yourself, but the chances are high that someone else did parts of your work already. Less variability reduces complexity and therefore enhances security.

There is the open-source Spring Framework for example, which uses Java as the underlying language (or .NET for Steeltoe). Both projects are managed by VMware and millions of developers use them.

Tanzu Spring Steeltoe

What happens next? You would now run your continuous integration (CI) process (integration tests, unit tests) and then you are ready to package or build your application.

Build – Tanzu Build Service (TBS)

So, your code is now good for release. If you want to deploy your application to a Kubernetes environment, then you need a secure, portable and reproducible build that can be checked for security vulnerabilities, and you need an easy way to patch those vulnerabilities.

How are you going to build your container image where you application is going to be built into? A lot of customers and vendors have a dockerfile based approach.

VMware recommends Tanzu Build Service (TBS), which uses Tanzu Buildpacks that are based on the open-source Cloud Native Buildpacks CNCF project to turn application source code into container images. So, no dockerfiles.

TBS is constantly looking for changes in your source code and then automatically builds an image based on that. This means with TBS you don’t need any advanced knowledge of container packaging formats or know how to optimally construct a container creation script for a given programming language.

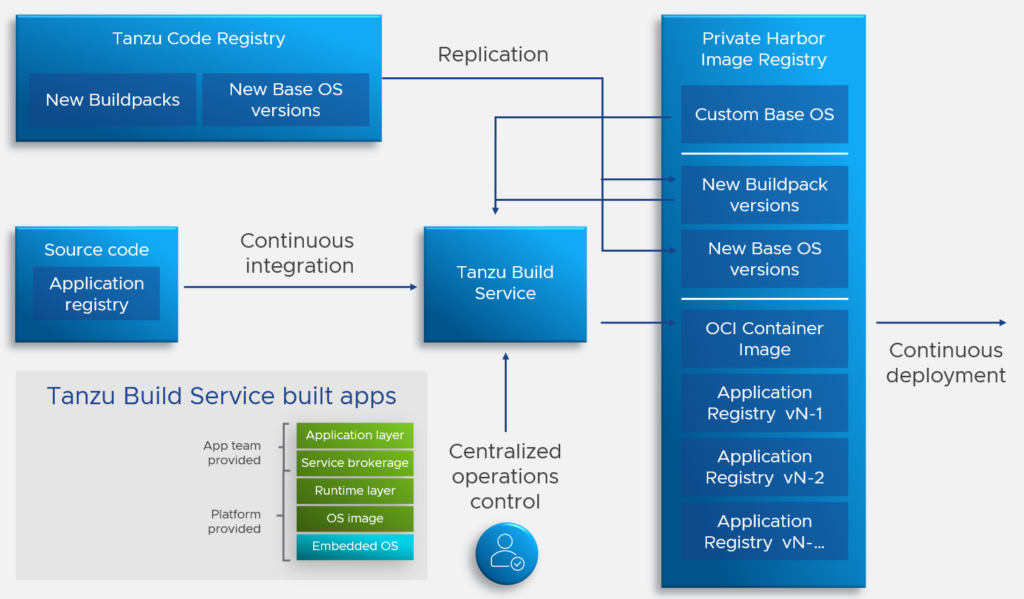
Tanzu Build Service knows all the images you have built and understands all the dependencies and components you have used. If something changes, your image is going to be rebuilt automatically and then stored in a registry of your choice. More about the registry in a second.

Tanzu Build Service

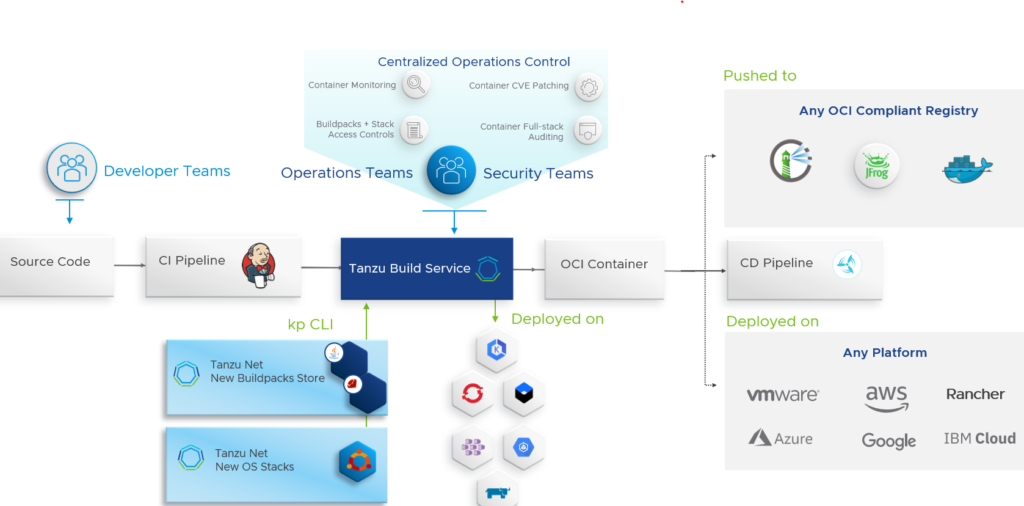
What happens if a vulnerability comes out and one of your libraries, operating systems or components is affected? TBS would patch this vulnerability and all the affected downstream container images would be updated automatically.

Imagine how happy your CISO would be about this way of building secure container images! 🙂

Build – Harbor

We have now pushed our container image to a container repository, a so-called registry. VMware uses Harbor (open-source cloud native registry by VMware, donated to the CNCF in 2018) as an enterprise-grade storage for container images. Additionally, Harbor provides static analysis of vulnerabilities in images through open-source projects like Trivy and Clair.

Tanzu Build Service Harbor

We have now developed our applications and stored our packaged images in our Harbor registry. What else do we need?

Build – VMware Application Catalog (VAC)

Developers are not going to build everything by themselves. Other services like databases or caching are needed to build the application as well and there are so many known and pre-packaged open-source software freely available online. This brings additional security risks and provides malicious actors to publish container images that contain vulnerabilities.

How can you mitigate this risk and reduce the chance for a critical application outage or breach?

In 2019, VMware acquired Bitnami, which delivers and maintains a catalog of 130+ pre-packaged and ready-to-use open-source application components, that are “continuously maintained and verifiably tested for use in production environments”.

Known as VMware Application Catalog (VAC, formerly also known as Tanzu Application Catalog), VAC as a SaaS offering provides your organization a customizable private collection of open-source software and services, that can automatically be placed in your private container image registry. In this case in your Harbor registry.

Example apps that are supported today:

Language Runtimes Databases App Components Developer Tools Business Apps
Nodejs MySQL Kafka Artifactory WordPress
Python PostgreSQL RabbitMQ Jenkins Drupal
Ruby MariaDB TensorFlow Redmine Magento
Java MongoDB ElasticSearch Harbor Moodle

How does it work?

VMware Application Catalog - How it works

There are two product features that I would like to highlight:

  • Build-time CVE scan reports for container images using Trivy
  • Build-time Antivirus scans for container images using ClamAV

Your application, built by Tanzu Build Service and VMware Application Catalog, is complete now, and stored in your Harbor registry. And since you use VAC, you also have your “marketplace” of applications, that is curated by a (security) team in your organization. 

If you want to see VAC in action, have a look at this Youtube video.

Note: Yes, VAC is a SaaS hosted application and you may have concerns because you are a public/federal customer. That’s no problem. Consider VAC as your trusted source where you can copy things from. There is no data stored in the public cloud nor does it run anything up there. Download your packages from this trusted repository over to you air gapped environment.

Run – Tanzu Kubernetes Grid (TKG)

Your application is ready to be deployed and the next step is in your pipeline is “continuous deployment“. We finally can deploy our applications to a Kubernetes cluster.

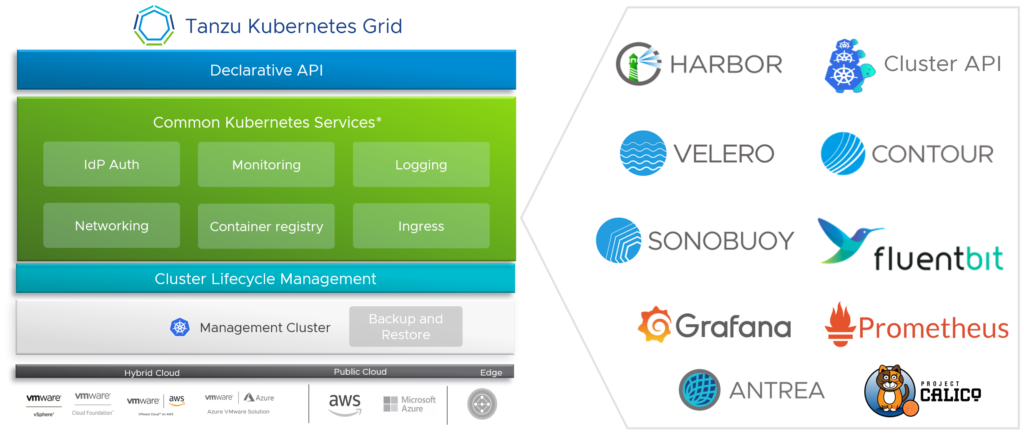
Tanzu Kubernetes Grid or TKG is VMware’s own consistent and conformant Kubernetes distribution that can run in any cloud. VMware’s strategy is about running the same Kubernetes dial tone across data centers and public cloud, which enables a consistent and secure experience for your developers.

TKG has a tight integration with vSphere called “vSphere with Tanzu”. Since TKG is an enterprise-ready Kubernetes for a multi-cloud infrastructure, it can run also in all major public clouds.

If consistent automation is important to you and you want to run Kubernetes in an air gapped environment, where there is no AWS, Azure or any other major public cloud provider, then a consistent Kubernetes version like TKG would add value to your infrastructure.

Manage/Operate – Tanzu Mission Control (TMC)

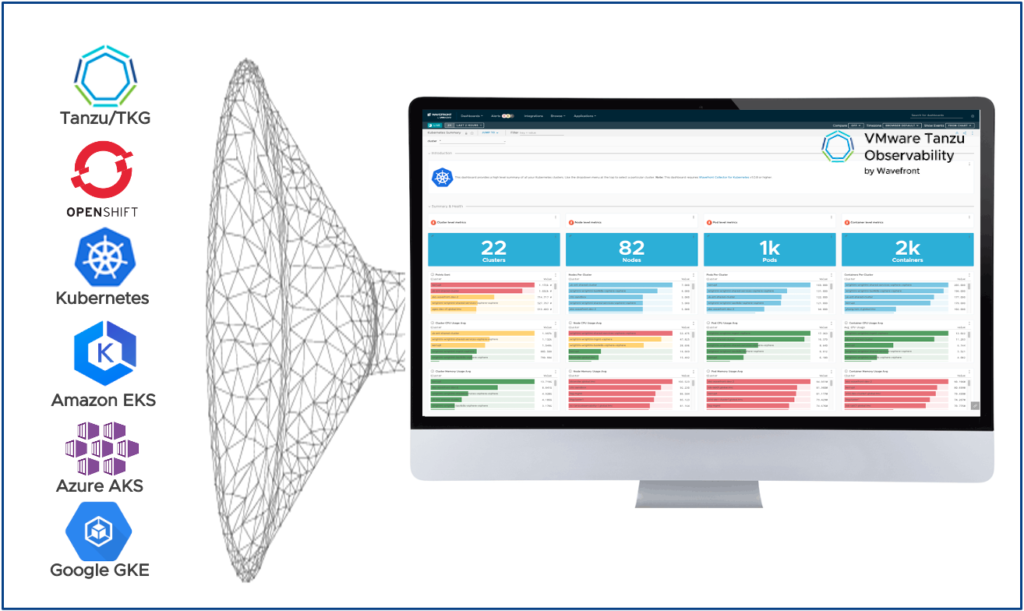
How do we manage these applications on any Kubernetes cluster (VMware TKG, Amazon EKS, Microsoft AKS, Google GKE), that can run in any cloud?

Some organizations started with TKG and others already started with managed Kubernetes offerings like EKS, AKS or GKE. That’s not a problem. The question here is how you deploy, manage, operate, and secure all these different clusters.

VMware’s solution for that is Tanzu Mission Control, which is also a SaaS-based tool hosted by VMware, that is the first offering I’m going to cover, that is part of a global Tanzu control plane. TMC is a solution that makes your multi-cloud and multi-cluster Kubernetes management much easier.

With TMC you’ll get:

  • Centralized Cluster Lifecycle Management. TMC enables automated provisioning and lifecycle management of TKG cluster across any cloud. It provides centralized provision, scaling, upgrading and deletion functions for your Kubernetes clusters. Tanzu Mission Control also allows you to attach any CNCF-conformant Kubernetes cluster (K8s on-prem, K8s in public cloud, TKG, EKS, AKS, GKE, OpenShift) to the platform for management, visibility, and analytic purposes. I would expect that we can use TMC in the future to lifecycle managed offerings like EKS, AKS or GKE.
  • Centralized Policy Management. TMC has a very powerful policy engine to apply consistent policies across clusters and clouds. You can create security, access, network, quota, registry, and custom policies (Open Policy Agent framework).
  • Identity and Access Management. Another important feature you don’t want to miss with DevSecOps in mind is centralized authentication and authorization, and identity federation from multiple sources like AD, LDAP and SAML. Make sure you give the right people or project teams the right access to the right resources.
  • Cluster Inspection. There are to inspection that you can run against your Kubernetes clusters. TMC leverages the built-in open-source project Sonobuoy that makes sure your cluster are configured in a conformant way with the Cloud Native Computing Foundation (CNCF) standards. Tanzu Mission Control provides CIS Benchmark inspection as another option.

Tanzu Mission Control

Tanzu Mission Control integrates with other Tanzu products like Tanzu Observability and Tanzu Service Mesh, which I’m covering later.

Connect – Antrea

VMware Tanzu uses Antrea as the default container network interface (CNI) and Kubernetes NetworkPolicy to provide network connectivity and security for your pods. Antrea is an open-source project with active contributors from Intel, Nvidia/Mellanox and VMware, and it supports multiple operating systems and managed Kubernetes offerings like EKS, AKS or GKE!

Antrea uses Open vSwitch (OvS) as the networking data plane in every Kubernetes node. OvS is a high performance and programmable virtual switch that not only supports Linux, but also Windows. VMware is working on the achievement to reach feature parity between them, and they are even working on the support for ARM hosts in addition to x86 hosts.

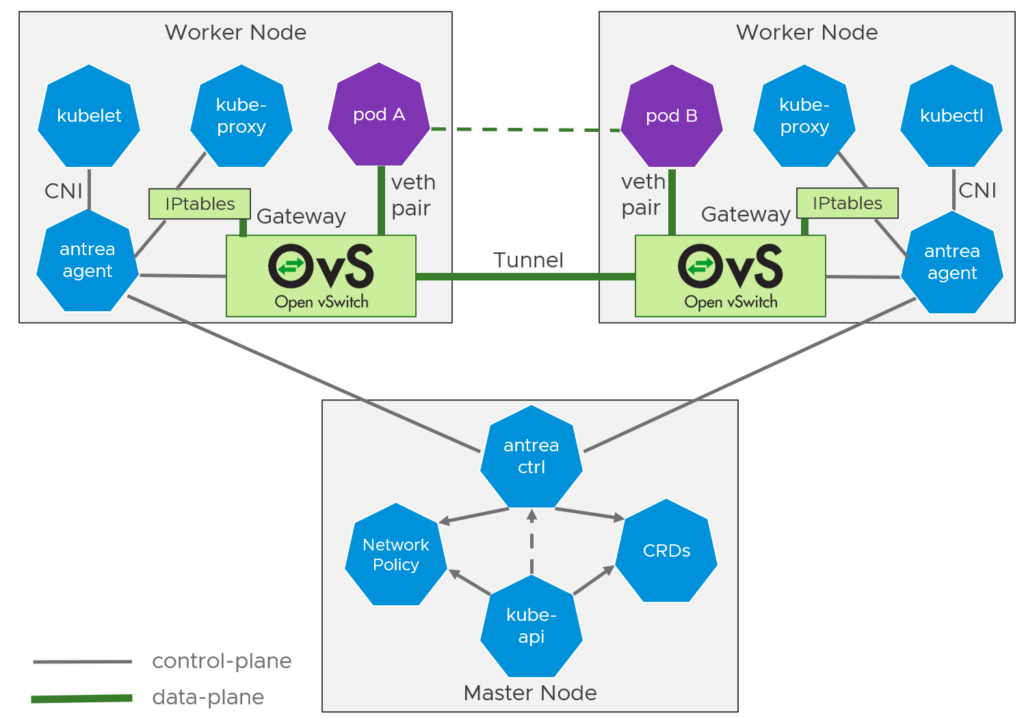
Antrea creates overlay networks using VXLAN or Geneve for encapsulation and encrypts node-to-node communication if needed.

Connect & Secure – NSX Advanced Load Balancer

Ingress is a very important component of Kubernetes and let’s you configure how an application can or should be accessed. It is a set of routing rules that describe how traffic is routed to an application inside of a Kubernetes cluster. So, getting an application up and running is only the half side of the story. The application still needs a way for users to access it. If you would like to know more about “ingress”, I can recommend this short introduction video.

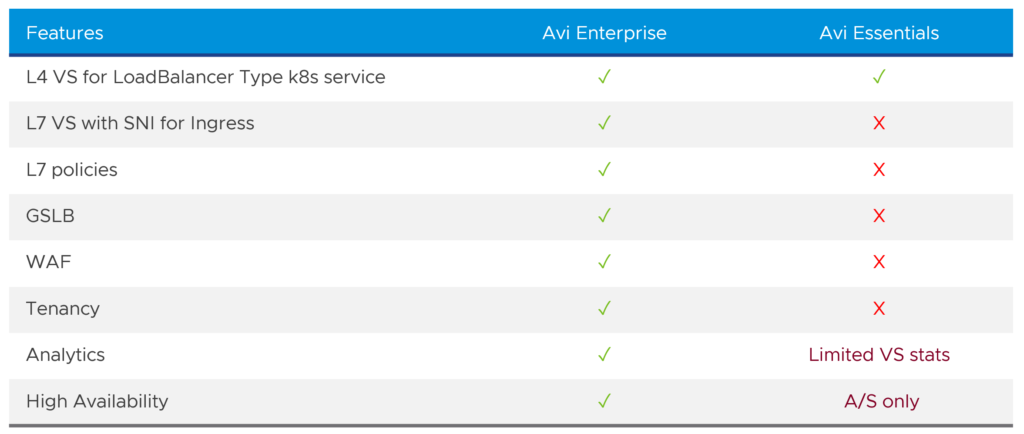
While a project like Contour is a great open-source project, VMware recommends Avi (aka NSX Advanced Load Balancer) provides much more enterprise-grade features like L4 load balancing, L7 ingress, security/WAF, GSLB and analytics. If stability, enterprise support, resiliency, automation, elasticity, and analytics are important to you, then Avi Enterprise, a true software-defined multi-cloud application delivery controller, is definitely the better fit.


Secure – Tanzu Service Mesh (TSM)

Let’s take a step back and recap what we have achieve until here. We have a standardized and automated application supply chain, with signed container images, that can be deployed in any conformant Kubernetes cluster. We can also access the application from outside and pod-to-pod communication, so that applications can talk to each other. So far so far good.

Is there maybe another way to stitch these services together or “offload” security from the containers? What if I have microservices or applications running in different clouds, that need to securely communicate with each other?

A lot of vendors including VMware realized that the network is the fabric that brings microservices together, which in the end form the application. With modernized or partially modernized apps, different Kubernetes offerings and a multi-cloud environment, we will find the reality of hybrid applications which sometimes run in multiple clouds.

This is the moment when you need to think about the connectivity and communication between your app’s microservices. Today, many Kubernetes users do that by implementing a service mesh and Istio is most probably the most used open-source project platform for that.

The thing with service mesh is, while everyone thinks it sounds great, that there are new challenges that service mesh brings by itself. The installation and configuration of Istio is not that easy and it takes time. Besides that, Istio is also typically tied to a single Kubernetes cluster and therefore Istio data plane – and organizations usually prefer to keep their Kubernetes clusters independent from each other. This leaves us with security and policies tied to a Kubernetes cluster or cloud vendor, which leaves us with silos.

Tanzu Service Mesh, built on VMware NSX, is an offering that delivers an enterprise-grade service mesh, built on top of a VMware-administrated Istio version.

The big difference and the value that comes with Tanzu Service Mesh (TSM) is its ability to support cross-cluster and cross-cloud use cases via Global Namespaces.

Global Namespaces

A Global Namespace is a unique concept in Tanzu Service Mesh and connects resources and workloads that form the application into a virtual unit. Each GNS is an isolated domain that provides automatic service discovery and manages the following functions that are port of it, no matter where they are located:

  • Identity. Each global namespace has its own certificate authority (CA) that provisions identities for the resources inside that global namespace
  • Discovery (DNS). The global namespace controls how one resource can locate another and provides a registry.
  • Connectivity. The global namespace defines how communication can be established between resources and how traffic within the global namespace and external to the global namespace is routed between resources.
  • Security. The global namespace manages security for its resources. In particular, the global namespace can enforce that all traffic between the resources is encrypted using Mutual Transport Layer Security authentication (mTLS).
  • Observability. Tanzu Service Mesh aggregates telemetry data, such as metrics for services, clusters, and nodes, inside the global namespace.

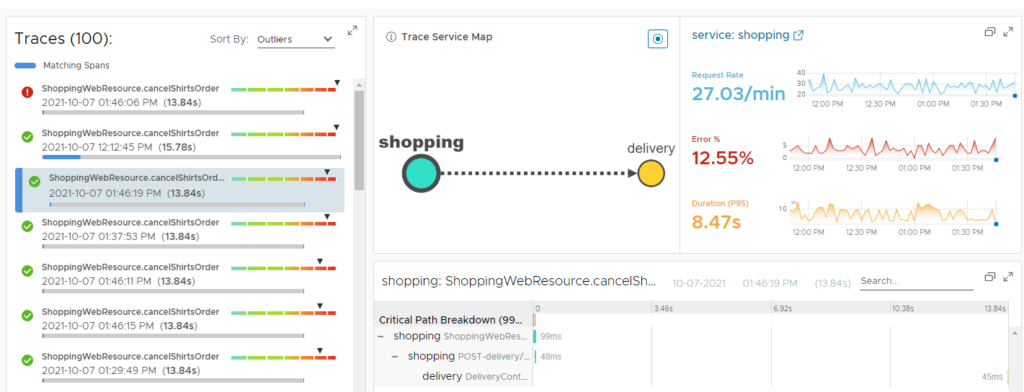
Monitor – Tanzu Observability (TO)

Another important part of DevSecOps with VMware Tanzu is observability. What happens if something goes wrong? What are you doing when an application is not working anymore as expected? How do you troubleshoot a distributed application, split in microservices, that potentially runs in multiple clouds?

Image an application split into different smaller services, that are running in a pod, which could be running in a virtual machine on a specific host in your on-premises datacenter, at the edge, or somewhere in the public cloud.

You need a tool that supports the architecture of a modern application. You need a solution that understands and visualizes cloud native applications.

That’s when VMware suggests Tanzu Observability to provide you observability and deep visibility across your DevSecOps environment.

Tanzu Observability

Tanzu Observability has an integration with Tanzu Mission Control, which has the capability then to install the Wavefront Kubernetes collector on your Kubernetes clusters. The name “Wavefront” comes from the company Wavefront, which VMware acquired in 2017.

Since Tanzu Observability is only offered as a SaaS version, I would like to highlight that it is “secure by design” according to VMware:

  • Isolation of customer data
  • User & Service Account Authentication (SSO, LDAP, SAML)
  • RBAC & Authorization
  • Data encryption at rest and in transit
  • Data at rest is managed by AWS S3 (protected by KMS)
  • Certifications like ISO 27001/27017/27018 or SOC 2 Type 1

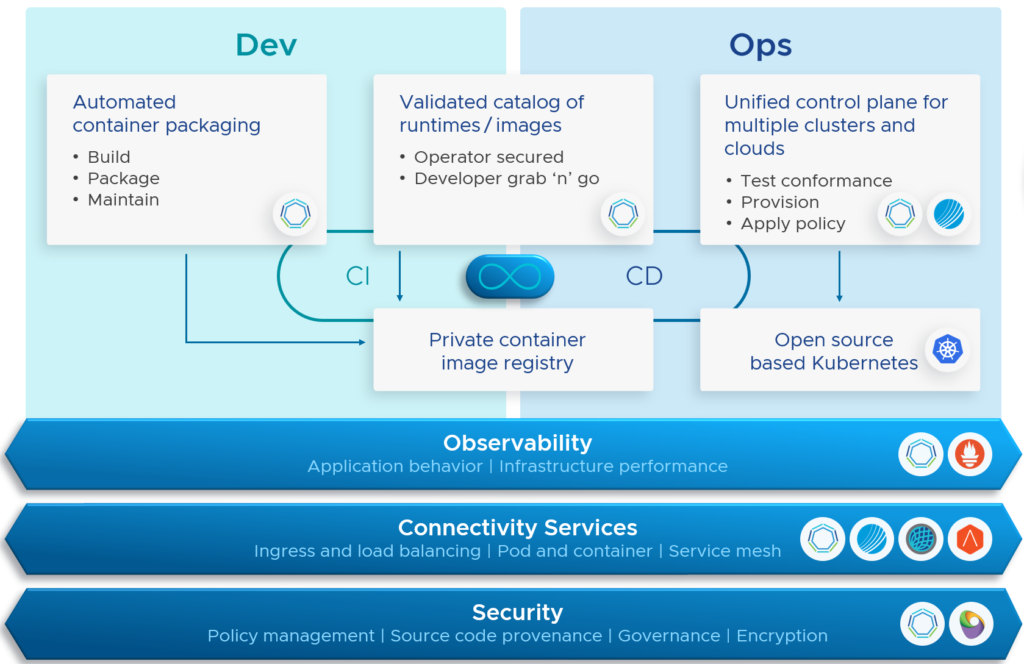
Summary – Tanzu Portfolio Capabilities

The container build and deploy process consists of the Spring runtime, Tanzu Application Catalog and Tanzu Build Service.

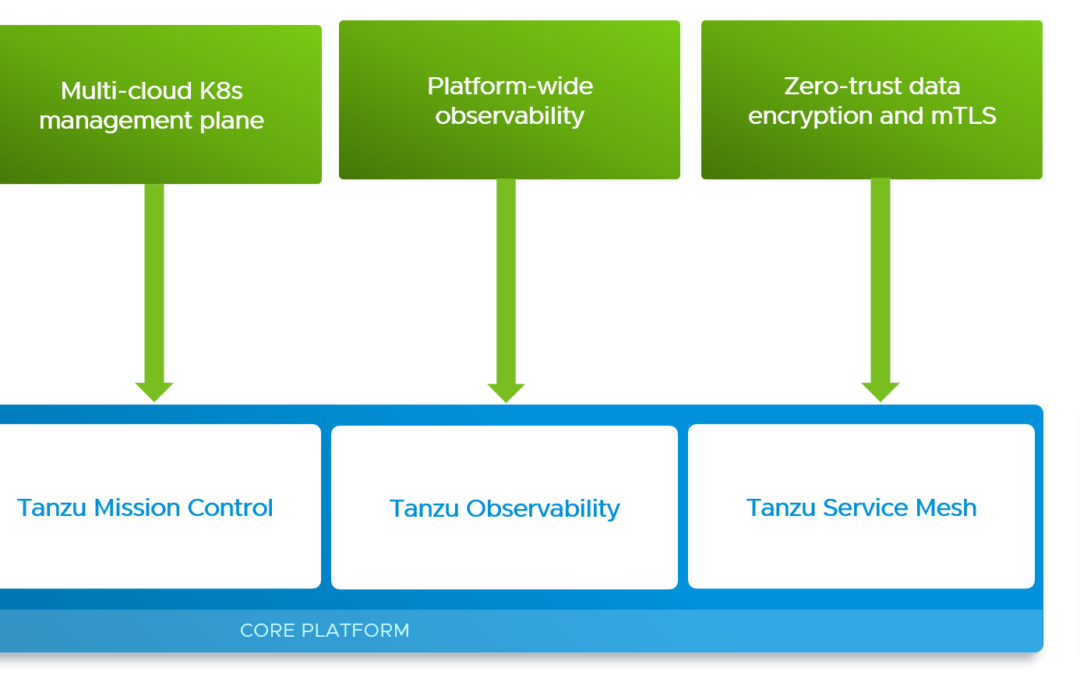
The global control plane (SaaS) is formed by Tanzu Mission Control, Tanzu Service Mesh and Tanzu Observability.

The networking layer consists of NSX Advanced Load Balancer for ingress & load balancing and uses Antrea for container networking.

The foundation of this architecture is built on VMware’s Kubernetes runtime called Tanzu Kubernetes Grid.

Tanzu Advanced Capabilities

Note: There are other components like Application Transformer or Tanzu SQL (part of Tanzu Data Services), which I haven’t covered in this article.

Secure – Carbon Black Cloud Container

Another solution that might be of interest for you is Carbon Black Container. CB Container also provide visibility and control that DevSecOps team need to secure Kubernetes clusters and the application the deploy on top of them.

This solution provides container vulnerability & risk dashboard, image scanning, compliance policy scanning, CI/CD integration, integration with Harbor and supports any upstream Kubernetes like TKG, EKS, AKS, GKE or OpenShift.

Conclusion

DevSecOps with VMware Tanzu helps you to simplify and secure the whole container and application lifecycle. VMware has made some strategic acquisitions (Heptio, Pivotal, Bitnami, Wavefront, Octarine, Avi Networks, Carbon Black) in the past to become a major player the world of containerization, Kubernetes and application modernization.

I personally believe that VMware’s approach and Tanzu portfolio have a very strong position in the market. Their modular approach and the inclusion of open-source projects is a big differentiator. Tanzu is not just about Kubernetes, it’s about building, securing and managing the applications.

If you have a strong security focus, VMware can cover all the layers up from the hypervisor to the applications that can be deployed in any cloud. That’s the strength and unique value of VMware: A complete and diverse portfolio with products, that provide even more value when combined together.

Don’t forget, that VMware is number 1 when it comes to data center infrastructures and most of the customer workloads are still running on-premises. That’s why I believe that VMware and their Tanzu portfolio are very well positioned.

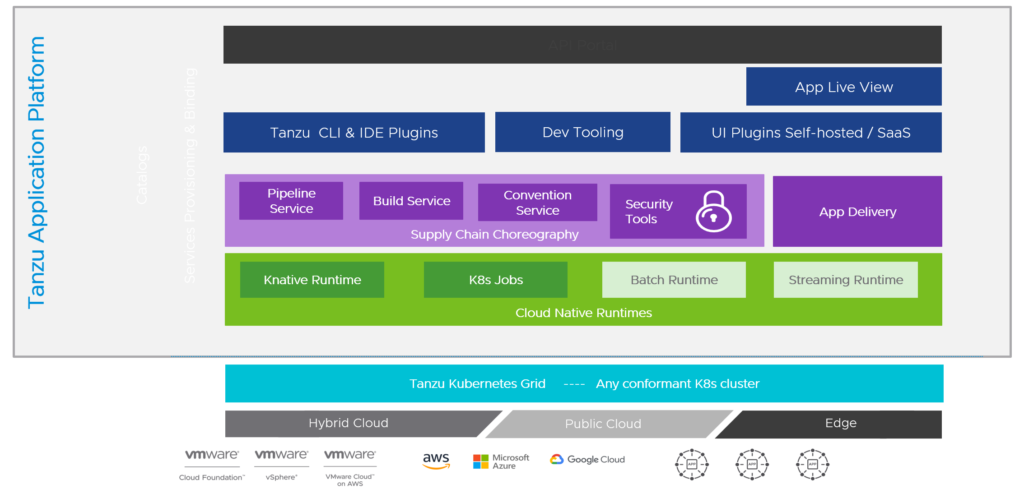
In case you missed it the announcements a few weeks ago, check out  Tanzu Application Platform and Tanzu for Kubernetes Operations that meet the needs of all those who are concerned with DevSecOps!

And if you would like to know more about VMware Tanzu in general, have a look at my “10 Things You Didn’t Know About VMware Tanzu” article.


What is Tanzu for Kubernetes Operations?

What is Tanzu for Kubernetes Operations?

Updated on March 16, 2022

The customers I worked with last year were large enterprises with a multi-cloud strategy and they have just started their application modernization journey. Typically, VMware customers interested in Tanzu would take a look at the Standard edition first, which gives you:

  • Tanzu Kubernetes Grid Runtime
  • Tanzu Mission Control Standard
  • Avi Essentials (NSX Advanced Load Balancer)
  • Antrea (open-source) for container networking
  • and some other open-source software like Prometheus, Grafana, Fluent Bit, Contour

Tanzu Std vs Adv

A lot of my customers were interested in Tanzu Advanced, but they were asking for something in between these editions. Tanzu Standard sounded very interesting, but almost all of them asked the followings questions:

  • What if I don’t build or modernize my own applications yet and get my application as a container from my ISV?
  • Prometheus and Grafana are nice, but I would like to have something more enterprise-ready for observability. How can I get Tanzu Observability?
  • Avi Essentials sounds great, but I am thinking to replace my current load balancer. Is it possible to replace my F5 or Citrix ADC (formerly known as Citrix NetScaler) appliances?
  • Contour seems to be a nice open-source project, but I am looking for something with built-in automation and analytics capabilities for ingress. Can’t I get Avi Enterprise for that as well?
  • I am looking for zero trust application security. How can you help me to encrypt traffic between containers or microservices, which could also be hosted on different clouds (e.g., on-prem and public cloud)?

The answer to these questions is Tanzu Kubernetes for Operations. Tanzu for Kubernetes Operations (TKO) is a bundle of VMware products and services to meet the requirements of cloud platform teams. It provides a centralized, consistent and simplified container management and operations across clouds and currently includes the following products and services:

Important Note: The VMware product guide says that “a Core is a single physical computational unit of the Processor which may be presented as one or more vCPUs“. So, if you plan a CPU overcommit of 1:2 (cores:vCPU) for your on-premises infrastructure, then you have to license 12 cores only.

TKO Reference Architecture

VMware has released TKO reference architectures for vSphere, AWS and Azure.

Figure 1 - Tanzu for Kubernetes Operations

Use this link to get additional information how to deploy and configure Tanzu Mission Control, Tanzu Observability and Tanzu Service Mesh.

What is Application Transformer for Tanzu?

Application Transformer for VMware Tanzu became generally available in February 2022.

Application Transformer can help you to convert virtual machines and application components to OCI-compliant container images, that then can be deployed into the Tanzu Kubernetes stack.

Tanzu Application Transformer


Tanzu App Navigator

Application Transformer helps you to analyze and visualize application components and dependencies. It also provides customers scores that allow them to decide which applications should be transformed.

App Navigator is a 4-to-6 week engagement that helps you to decide which applications you should tackle first and how much change is needed to drive business outcomes. It’s one thing to containerize an application, but App Navigator helps you to create a modernization strategy based on your goals.

Note: VMware’s App Navigator team uses Application Transformer during their service engagement.

Tanzu App Navigator

Tanzu Application Platform

Deploying an application on Kubernetes is not an easy thing if you don’t know anything about Kubernetes.

If you would like to focus more on your applications and your developer’s experience, then Tanzu Application Platform (TAP) could be very interesting for you.

With Tanzu Application Platform, application developers and operations teams can build and deliver a better multi-cloud developer experience on any Kubernetes distribution, including Azure Kubernetes Service, Amazon Elastic Kubernetes Service, Google Kubernetes Engine, as well as software offerings like Tanzu Kubernetes Grid.

VMware is known to provide reduction of complexity and to provide cloud-agnostic infrastructures. They started to abstract the underlying server hardware, then the virtualization of the whole data center (compute, storage, network) came and the next step was the abstraction of public clouds like AWS, Azure and Google.

In the case of Tanzu Application Platform we are talking about an opinionated grouping of separate components that run on any conformant Kubernetes cluster (TKG, AKS, EKS, GKE, OpenShift etc.). From an application developer perspective an application can automatically be built, tested and deployed on Kubernetes.

Tanzu Application Platform

Meaning, with TAP you get a modular application developer PaaS (adPaaS) offering and true application platform portability with the capability of “bring-your-own-Kubernetes”.


10 Things You Didn’t Know About VMware Tanzu

10 Things You Didn’t Know About VMware Tanzu

Updated on March 16, 2022

While I was working with one of the largest companies in the world during the past year, I learned a lot about VMware Tanzu and NSX Advanced Load Balancer (formerly known as Avi). Application modernization and the containerization of applications are very complex topics.

Customers are looking for ways to “free” their apps from infrastructure and want to go cloud-native by using/building microservices, containers and Kubernetes. VMware has a large portfolio to support you on your application modernization journey, which is the Tanzu portfolio. A lot of people still believe that Tanzu is a product – it’s not a product. Tanzu is more than just a Kubernetes runtime and as soon as people like me from VMware explain you the capabilities and possibilities of Tanzu, one tends to become overwhelmed at first.

Why? VMware’s mission is always to abstract things and make things easier for you but this doesn’t mean you can skip a lot of the questions and topics that should be discussed:

  • Where should your containers and microservices run?
  • Do you have a multi-cloud strategy?
  • How do you want to manage your Kubernetes clusters?
  • How do you build your container images?
  • How do you secure the whole application supply chain?
  • Have you thought about vulnerability scanning for the components you use to build the containers?
  • What kind of policies would you like to set on application, network and storage level?
  • Do you need persistent storage for your containers?
  • Should it be a vSphere platform only or are you also looking at AKS, EKS, GKE etc.?
  • How are you planning to automate and configure “things”?
  • Which kind of databases or data services do you use?
  • Have you already got a tool for observability?

With these kind of questions, you and I would figure out together, which Tanzu edition makes the most sense for you. Looking at the VMware Tanzu website, you’ll find four different Tanzu editions:

VMware Tanzu Editions

If you click on one of the editions, you get the possibility to compare them:

Tanzu Editions Comparison

Based on the capabilities listed above, customers would like to know the differences between Tanzu Standard and Advanced. Believe me, there is a lot of information I can share with you to make your life easier and to understand the Tanzu portfolio better. 🙂

1) VMware Tanzu Standard and Advanced Features and Components

Let’s start looking at the different capabilities and components that come with Tanzu Standard and Advanced:

Tanzu Std vs Adv

Tanzu Standard focuses very much on Kubernetes multi-cloud and multi-cluster management (Tanzu Kubernetes Grid with Tanzu Mission Control aka TMC), Tanzu Advanced adds a lot of capabilities to build your applications (Tanzu Application Catalog, Tanzu Build Service).

2) Tanzu Mission Control Standard and Advanced

Maybe you missed it in the screenshot before. Tanzu Standard comes with Tanzu Mission Control Standard, Tanzu Advanced is equipped with Tanzu Mission Control Advanced.

Note: Announced at VMworld 2021, there is now even a third edition called Tanzu Mission Control Essentials, that was specifically made for VMware Cloud offerings such as VMC on AWS.

I must mention here, that you could leverage the “free tier” of Tanzu Mission Control called TMC Starter. It can be combined with the Tanzu Community Edition (also free) for example or with existing clusters from other providers (AKS, GKE, EKS).

What’s the difference between TMC Standard and Advanced? Let’s check the TMC feature comparison chart:

  • TMC Adv provides “custom roles”
  • TMC Adv lets you configure more policies (security policies – custom, images policies, networking policies, quota policies, custom policies, policy insights)
  • With Tanzu Mission Control Advanced you also get “CIS Benchmark inspections”

What if I want Tanzu Standard (Kubernetes runtime with Tanzu Mission Control and some open- source software) but not the complete feature set of Tanzu Mission Control Advanced? Let me answer that question a little bit later. 🙂

3) NSX Advanced Load Balancer Essentials vs. Enterprise (aka Avi Essentials vs. Enterprise)

Yes, there are also different NSX ALB editions included in Tanzu Standard and Advanced. The NSX ALB Essentials edition is not something that you can buy separately, and it’s only included in the Tanzu Standard edition.

The enterprise edition of NSX ALB is part of Tanzu Advanced but it can also be bought as a standalone product.

Here are the capabilities and differences between NSX ALB Essentials and Enterprise:

NSX ALB Essentials vs. Enterprise

So, the Avi Enterprise edition provides a fully-featured version of NSX Advanced Load Balancer while Avi Essentials only provides L4 LB services for Tanzu.

Note: Customers can create as many NSX ALB / Avi Service Engines (SEs) as required with the Essentials edition and you still have the possibility to set up a 3-node NSX ALB controller cluster.

Important: It is not possible to mix the NSX ALB controllers from the Essentials and Enterprise edition. This means, that a customer, that has NSX ALB Essentials included in Tanzu Standard, and has another department using NSX ALB Enterprise for another use case, needs to run separate controller clusters. While the controllers don’t cost you anything, there is obviously some additional compute footprint coming with this constraint.

FYI, there is also a cloud-managed option for the Avi Controllers with Avi SaaS.

What if I want the complete feature set of NSX ALB Enterprise? Let’s put this question also aside for a moment.

4) Container Ingress with Contour vs. NSX ALB Enterprise

Ingress is a very important component of Kubernetes and let’s you configure how an application can or should be accessed. It is a set of routing rules that describe how traffic is routed to an application inside of a Kubernetes cluster. So, getting an application up and running is only the half side of the story. The application still needs a way for users to access it. If you would like to know more about “ingress”, I can recommend this short introduction video.

While Contour is a great open-source project, Avi provides much more enterprise-grade features like L4 LB, L7 ingress, security/WAF, GSLB and analytics. If stability, enterprise support, resiliency, automation, elasticity and analytics are important to you, then Avi Enterprise is definitely the better fit.

To keep it simple: If you are already thinking about NSX ALB Enterprise, then you could use it for K8s Ingress/LB and so much other use cases and services! 🙂  

5) Observability with Grafana/Prometheus vs. Tanzu Observability

I recently wrote a blog about “modern application monitoring with VMware Tanzu and vRealize“. This article could give you a better understanding if you want to get started with open-source software or something like Tanzu Observability, which provides much more enterprise-grade features. Tanzu Observability is considered to be a fast-moving leader according to the GigaOm Cloud Observability Report.

What if I still want Tanzu Standard only but would like to have Tanzu Observability as well? Let’s park this question as well for another minute.

6) Open-Source Projects Support by VMware Tanzu

The Tanzu Standard edition comes with a lot of leading open-source technologies from the Kubernetes ecosystem. There is Harbor for container registry, Contour for ingress, Grafana and Prometheus for monitoring, Velero for backup and recovery, Fluentbit for logging, Antrea and Calico for container networking, Sonobuoy for conformance testing and Cluster API for cluster lifecycle management.

VMware Open-Source Projects

VMware is actively contributing to these open-source projects and still wants to give customers the flexibility and choice to use and integrate them wherever and whenever you see fit. But how are these open-source projects supported by VMware? To answer this , we can have a look at the Tanzu Toolkit (included in Tanzu Standard and Advanced):

  • Tanzu Toolkit includes enterprise-level support for Harbor, Velero, Contour, and Sonobuoy
  • Tanzu Toolkit provides advisory—or best effort—guidance on Prometheus, Grafana, and Alertmanager for use with Tanzu Kubernetes Grid. Installation, upgrade, initial tooling configuration, and bug fixes are beyond the current scope of VMware’s advisory support.

7) Tanzu Editions Licensing

There are two options how you can license your Tanzu deployments:

  • Per CPU Licensing – Mostly used for on-prem deployments or where standalone installations are planned (dedicated workload domain with VCF). Tanzu Standard is included in all the regular VMware Cloud Foundation editions.
  • Per Core Licensing – For non-standalone on-prem and public cloud deployments, you should license Tanzu Standard and Advanced based on number of cores used by the worker (including control plane VMs) and management nodes delivering K8s clusters. Constructs such as “vCPUs”, “virtual CPUs” and “virtual cores” are proxies (other names) for CPU cores.

Tanzu Advanced is sold as a “pack” of software and VMware Cloud service offerings. Each purchased pack of Tanzu Advanced equals 20 cores. Example of 1 pack:

  • Spring Runtime: 20 cores
  • Tanzu Application Catalog: 20 cores
  • Tanzu SQL: 1 core (part of Tanzu Data Services)
  • Tanzu Build Service: 20 cores
  • Tanzu Observability: 160 PPS (sufficient to collect metrics for the infrastructure)
  • Tanzu Mission Control Advanced: 20 cores
  • Tanzu Service Mesh Advanced: 20 cores
  • NSX ALB Enterprise: 1 CPU = 1/4 Avi Service Core
  • Tanzu Standard Runtime: 20 cores

If you need more details about these subscription licenses, please consult the VMware Product Guide (starting from page 37).

As you can see, a lot of components (I didn’t even list all) form the Tanzu Advanced  edition. The calculation, planning and sizing for the different components require multiple discussions with your Tanzu specialist from VMware.

8) Tanzu Standard Sizing

Disclaimer – This sizing is based on my current understanding, and it is always recommended to do a proper sizing with your Tanzu specialists / consultants.

So, we have learnt before that Tanzu Standard licensing is based on cores, which are “used by the worker and management nodes delivering K8s clusters”.

As you may already know, the so-called “Supervisor Cluster” is currently formed by three control plane VMs. Looking at the validated design for Tanzu for VMware Cloud Foundation workload domains, one can also get a better understanding of the Tanzu Standard runtime sizing for vSphere-only environments.

The three Supervisor Cluster (management nodes) VMs have each 4 vCPUs – this means in total 12 vCPUs.

The three Tanzu Kubernetes Cluster control plane VMs have each 2 vCPUs – this means in total 6 vCPUs.

The three Tanzu Kubernetes Cluster worker nodes (small size) have each 2 vCPUs – this means in total 6 vCPUs.

My conclusion here is that you need to license at least 24 vCPU to get started with Tanzu Standard.

Important Note: The VMware product guide says that “a Core is a single physical computational unit of the Processor which may be presented as one or more vCPUs“. If you are planning a CPU overcommit of 1:2 (cores:vCPU) for your on-premises infrastructure, then you have to license 12 cores only.

Caution: William Lam wrote about the possibility to deploy single or dual node Supervisor Cluster control plane VMs. It is technically possible to reduce the numbers of control plane VMs, but it is not officially supported by VMware. We need to wait until this feature becomes available in the future.

It would be very beneficial for customers with a lot of edge locations or smaller locations in general. If you can reduce the Supervisor Cluster down to two control plane VMs only, the initial deployment size would only need 14 vCPUs (cores).

9) NSX Advanced Load Balancer Sizing and Licensing

General licensing instructions for Avi aka NSX ALB (Enterprise) can be found here

NSX ALB is licensed based on cores consumed by the Avi Service Engines. As already said before, you won’t be charged for the Avi Controllers and itt is possible to add new licenses to the ALB Controller at any time. Avi Enterprise licensing is based on so-called Service Cores. This means, one vCPU or core equals one Service Core.

Avi as a standalone product has only one edition, the fully-featured Enterprise edition. Depending on your needs and the features (LB, GSLB, WAF, analytics, K8s ingress, throughput, SSL TPS etc.) you use, you’ll calculate the necessary amount of Service Cores.

It is possible to calculate and assign more or less than 1 Service Core per Avi Service Engine:

  • 25 Mbps throughput (bandwidth) = 0.4 Service Cores
  • 200 Mbps throughput = 0.7 Service Cores

Example: A customer wants to deploy 10 Service Engines with 25MB and 4 Service Engines with 200MB. These numbers would map to 10*0.4 Service Cores + 4*0.7 Services Cores, which give us a total of 6.8 Service Cores. In this case you would by 7 Service Cores. 

10) Tanzu for Kubernetes Operations (TKO)

Now it’s time to answer the questions we parked before:

  • What if I want Tanzu Standard (Kubernetes runtime with Tanzu Mission Control and some open- source software) but not the complete feature set of Tanzu Mission Control Advanced?
  • What if I want the complete feature set of NSX ALB Enterprise?
  • What if I still want Tanzu Standard only but would like to have Tanzu Observability as well?

The answer to this and the questions above is Tanzu for Kubernetes Operations (TKO)!

Conclusion

Wherever you are on your application modernization journey, VMware and their Tanzu portfolio got your back covered. Not matter if you want to start small, make your first steps and experiences with open-source projects, or if you want to have a complete set with the Tanzu Advanced edition, VMware offers the right options and flexibility.

I hope my learnings from this customer engagement help you to better understand the Tanzu portfolio and its capabilities.

Please leave your comments and thoughts below. 🙂

Modern Application Monitoring with VMware Tanzu and vRealize

Modern Application Monitoring with VMware Tanzu and vRealize

The complexity of applications has increased because of new cloud technologies and new application architectures. Since organizations adopt and embrace the DevOps mindset, developers and IT operations are closer than ever. Developers are now part of the team operating the distributed systems.

Businesses must figure out how they know about system failures and need to have an understanding “what” is broken (symptom) and “why” (possible cause) something is broken.

Let’s talk about application performance management (APM) and enterprise observability. 🙂

Monitoring

It was around the year 2012 or 2013 when I had to introduce a new monitoring solution for a former employer who was a cloud service provider. I think Nagios was the state-of-the-art technology back then and I replaced it PRTG Network Monitor from Paessler.

When we onboarded a new customer infrastructure or application, the process was always the same. I had to define the metrics to collect and then put those metrics on a dashboard. It was very important to set alerts based on thresholds or conditions. Everyone knew back then that this approach wasn’t the best, but we didn’t have any other choice.

PRTG Sensor View

If an IP was not pingable or a specific port of a server or application was down for 60 seconds, an alert popped up and an e-mail had been sent to the IT helpdesk. And in the dashboard you could see sensors switching from a green to a red state.

To simplify the troubleshooting process and to have some a logical application view, I had to create some dependencies between sensors. This was probably the only way to create something like an application (dependency) mapping.

When users worked on a virtual desktop or on a Windows Terminal Server, we “measured” the user experience and application performance based on network latency and server resource usage based on CPU and RAM mostly.

Observability

Observability enables you to drill down into the distributed services and systems (hardware components, containers, microservices) that make up an application.

Monitoring and observability are not the same thing. As described before, monitoring is the process of collection metrics and alerts that one can monitor the health and performance of components like network devices, databases, servers or VMs.

Observability helps you to understand complex architectures and interactions between elements in this architecture. It also allows you to troubleshoot performance issues, identify root causes for failures faster and helps you to optimize your cloud native infrastructure and applications.

In other words, observability can help you to speed up mean time to detection (MTTD) and mean time to resolution (MTTR) for infrastructure and application failures.

There are three golden telemetry signals to achieve observability (source):

  • Logs: Logs are the abiding records of discrete events that can identify unpredictable behavior in a system and provide insight into what changed in the system’s behavior when things went wrong. It’s highly recommended to ingest logs in a structured way, such as in JSON format so that log visualization systems can auto-index and make logs easily queryable.
  • Metrics: Metrics are considered as the foundations of monitoring. They are the measurements or simply the counts that are aggregated over a period of time. Metrics will tell you how much of the total amount of memory is used by a method, or how many requests a service handles per second.
  • Traces: A single trace displays the operation as it moves from one node to another in a distributed system for an individual transaction or request. Traces enable you to dig into the details of particular requests to understand which components cause system errors, monitor flow through the modules, and discover the bottlenecks in the performance of the system.

Tanzu Observability Tracing

When using observability during app development, it can also improve the developer experience and productivity.

Tanzu Observability Services

The VMware Tanzu portfolio currently has four different editions:

Different Tanzu Observability services are available for different components and Tanzu editions.

Tanzu Standard Observability

Tanzu Standard includes the leading open-source projects Prometheus and Grafana for platform monitoring (and Fluent Bit for log forwarding).

Tanzu Kubernetes Grid provides monitoring with the open-source Prometheus and Grafana services. You deploy these services on your cluster and can then take advantage of Grafana visualizations and dashboards. As part of the integration, you can set up Alertmanager to send alerts to Slack or use custom Webhooks alert notifications.

Tanzu Kubernetes Grid architecture

Tanzu Standard Observability is comprised of:

  • Fluent Bit is an open-source log processor and forwarder which allows you to collect any data like metrics and logs from different sources, enrich them with filters and send them to multiple destinations. It’s the preferred choice for containerized environments like Kubernetes.
  • Grafana is a multi-platform open-source analytics and interactive visualization web application. It provides charts, graphs, and alerts for the web when connected to supported data sources.
  • Prometheus is a free software application used for event monitoring and alerting. It records real-time metrics in a time series database built using a HTTP pull model, with flexible queries and real-time alerting.

Note: VMware only provides advisory (best effort) guidance on Prometheus and Grafana for use with Tanzu Kubernetes Grid. The installation, configuration and upgrades are beyond the current scope of VMware’s advisory support.

Tanzu Advanced Observability

In May 2017 VMware acquired Wavefront which is now part of the Tanzu portfolio and called “Tanzu Observability” (TO).

TO is a SaaS-based metrics monitoring and analytics platform that handles enterprise-scale requirements of modern cloud native application.

Compared to the Grafana/Prometheus, one would say that Tanzu Observability is a true enterprise-grade observability platform. According to the GigaOm Cloud Observability Report VMware Tanzu Observability is one of the strong leaders among Dynatrace and Splunk just to name a few.

Tanzu Observability is best suited for large organization and provides a consumption-based pricing that is based on the rate at which you send metric data to Tanzu Observability during the course of each month. This gives you the flexibility to start with any size want and scale up/down as needed. It’s not dependent on number of hosts or the number of users. 

Tanzu Observability CIO Dashboard

Tanzu Observability allows you to collect data from different sources and provides integrations to over 250 technologies including different public clouds, web application and services, big data frameworks, data stores, other monitoring tools, operating systems / hosts, and many more.

Tanzu Observability Integrations

While data retention with Prometheus is limited to a maximum of 14 days, VMware allows you to send Prometheus data to Tanzu Observability for long-term data retention (up to 18 months at full granularity).

Just announced at VMworld 2021, VMware has added artificial intelligence and machine learning (AI/ML) root cause capabilities…

Tanzu Observability AI Powered Root Cause Analysis

…and created an integration between Tanzu Observability and vRealize Operations Cloud.

Through this integration, developers and SREs can now view vRealize Operations Cloud metrics alongside all the metrics, histograms, and traces collected by Tanzu Observability from other sources for a more holistic view of business-critical applications and infrastructure.

If you are attending VMworld, check out the sessions below to learn more about Tanzu Observability.

  • APP1308: Observability for Modern Application and Kubernetes Environments
  • APP2648: Implement Observability for Kubernetes Clusters and Workloads in Minutes
  • VI2630: Best Practices and Reference Framework for Implementing Observability
  • UX2551: Move from Traditional Monitoring to Observability and SRE – Design Studio
  • VMTN2810: Lost in Containers? Enhance Observability with Actionable Visualization
  • 2965: Kubernetes Cluster Operations, Monitoring and Observability
  • 2957: Build a Data Analytics Platform in Minutes Using Deployment Blueprints
  • APP2677: Meet the Experts: VMware Tanzu Observability by Wavefront
  • VMTN3230: Observe Application internals Holistically
  • VI1448: Take a Modern Approach to Achieve Application Resiliency
  • APP1319: Transforming Customer Experiences with VMware’s App Modernization Platform

Integration with other Tanzu Products

Tanzu Observability is fully integrated within the Tanzu family with OOTB integrations with:

Kubernetes Monitoring in vRealize Operations

Tanzu Observability provides “Kubernetes Observability” and OOTB integrations with RedHat OpenShift, Azure Kubernetes Service (AKS), Amazon EKS and Google GKE for example.

Tanzu Observability Kubernetes Monitoring

vRealize Operations (vROps) is also able to monitor multiple Kubernetes environments like VMware Tanzu Kubernetes Grid, RedHat OpenShift, Amazon EKS, Azure AKS or Google GKE. That is made possible with the vROps Management Pack for Kubernetes.

Using vRealize Operations Management Pack for Kubernetes (needs vROps 8.1 or later), you can monitor, troubleshoot, and optimize the capacity management for Kubernetes clusters. Below some of the additional capabilities that this management pack delivers:

  • Auto-discovery of Tanzu Kubernetes Grid (TKG) or Tanzu Mission Control (TMC) Kubernetes clusters.
  • Complete visualization of Kubernetes cluster topology, including namespaces, clusters, replica sets, nodes, pods, and containers.
  • Performance monitoring for Kubernetes clusters.
  • Out-of-the-box dashboards for Kubernetes constructs, which include inventory and configuration.
  • Multiple alerts to monitor the Kubernetes clusters.
  • Mapping Kubernetes nodes with virtual machine objects.
  • Report generation for capacity, configuration, and inventory metrics for clusters or pods.

vRealize Operations K8s Monitoring

Note: Kubernetes monitoring is available in vRealize Operations Advanced.

There is also a Prometheus integration, that enables vRealize Operations Manager to retrieve metrics directly from Prometheus:

Diagram Description automatically generated

Note: vRealize Operations can also integrate with your existing application performance management systems. vROps offers integrations with App Dynamics, DataDog, Dynatrace and New Relic.

Conclusion

There are different options available within the VMware Tanzu and vRealize when it comes to Kubernetes operations, monitoring and observability.

Depending on your current needs and toolset you’ll have different options and integration possibilities. 

VMware’s portfolio gives you the choice to use open-source software like Grafana/Prometheus, leverage an existing vRealize Operations deployment or to get an enterprise-grade observability and analytics platform like Tanzu Observability.

If you are looking for and end-to-end monitoring stack aka 360-degree visibility for your K8s environments and clouds, VMware Tanzu and the vRealize Suite give you the following products:

  1. Applications – Tanzu Observability
  2. Kubernetes Cluster – Tanzu Observability, vRealize Operations, vRealize Network Insight, vRealize Log Insight
  3. Network Layer – vRealize Operations, vRealize Network Insight, vRealize Log Insight
  4. Virtualization Layer – vRealize Operations, vRealize Network Insight, vRealize Log Insight


VMworld 2021 – Summary of VMware Projects

VMworld 2021 – Summary of VMware Projects

On day 1 of VMworld 2021 we have heard and seen a lot of super exciting announcements. I believe everyone is excited about all the news and innovations VMware has presented so far.

I’m not going to summarize all the news from day 1 or day 2 but thought it might be helpful to have an overview of all the VMware projects that have been mentioned during the general session and solution keynotes.

Project Cascade

VMware Project Cascade

Project Cascade will provide a unified Kubernetes interface for both on-demand infrastructure (IaaS) and containers (CaaS) across VMware Cloud – available through an open command line interface (CLI), APIs, or a GUI dashboard.  Project Cascade will be built on an open foundation, with the open-sourced VM Operator as the first milestone delivery for Project Cascade that enables VM services on VMware Cloud.

VMworld 2021 session: Solution Keynote: The VMware Multi-Cloud Computing Infrastructure Strategy of 2021 [MCL3217]

Project Capitola

VMware Project Capitola

Project Capitola is a software-defined memory implementation that will aggregate tiers of different memory types such as DRAM, PMEM, NVMe and other future technologies in a cost-effective manner, to deliver a uniform consumption model that is transparent to applications.

VMworld 2021 session: Introducing VMware Project Capitola: Unbounding the ‘Memory Bound’ [MCL1453] and How vSphere Is Redefining Infrastructure For Running Apps In the Multi-Cloud Era [MCL2500]

Project Ensemble

VMware Project Ensemble

Project Ensemble integrates and automates multi-cloud management with vRealize. This means that all the different VMware cloud management capabilities—self-service, elasticity, metering, and more—are in one place. You can access all the data, analytics, and workflows to easily manage your cloud deployments at scale.

VMworld 2021 session: Introducing Project Ensemble Tech Preview [MCL1301]

Project Arctic

VMware Project Arctic

Project Arctic is “the next evolution of vSphere” and is about bringing your own hardware while taking advantage of VMware Cloud offerings to enable a hybrid cloud experience. Arctic natively integrates cloud connectivity into vSphere and establishes hybrid cloud as the default operating model.

VMworld 2021 session: What’s New in vSphere [APP1205] and How vSphere Is Redefining Infrastructure For Running Apps In the Multi-Cloud Era [MCL2500]

Project Monterey

VMware Project Monterey

Project Monterey was announced in the VMworld 2020 keynote. It is about SmartNICs that will redefine the data center with decoupled control and data planes for management, networking, storage and security for VMware ESXi hosts and bare-metal systems.

VMworld 2021 session: 10 Things You Need to Know About Project Monterey [MCL1833] and How vSphere Is Redefining Infrastructure For Running Apps In the Multi-Cloud Era [MCL2500]

Project Iris

I don’t remember anymore which session mentioned Project Iris but it is about the following:

Project Iris discovers and analyzes an organization’s full app portfolio; recommends which apps to rehost, replatform, or refactor; and enables customers to adapt their own transformation journey for each app, line of business, or data center.

Project Pacific

Project Pacific was announced at VMworld 2019. It is about re-architecting vSphere to integrate and embed Kubernetes and is known as “vSphere with Tanzu” (or TKGS) today. In other words, Project Pacific transformed vSphere into a Kubernetes-native platform with an Kubernetes control plane integrated directly into ESXi and vCenter. Pacific is part of the Tanzu portofolio.

VMworld 2019 session: Introducing Project Pacific: Transforming vSphere into the App Platform of the Future [HBI4937BE]

Project Santa Cruz

VMware Project Santa Cruz

Project Santa Cruz is a new integrated offering from VMware that adds edge compute and SD-WAN together to give you a secure, scalable, zero touch edge run time at all your edge locations. It connects your edge sites to centralized management planes for both your networking team and your cloud native infrastructure team. This solution is OCI compatible: if your app runs in a container, it can run on Santa Cruz.

VMworld 2021 session: Solution Keynote: What’s Next? A Look inside VMware’s Innovation Engine [VI3091]

Project Dawn Patrol

Project Dawn Patrol

So far, Project Dawn Patrol was only mentioned during the general session. “It will give you full visibility with a map of all your cloud assets and their dependencies”, Dormain Drewitz said.

VMworld 2021 session: General Session: Accelerating Innovation, Strategies for Winning Across Clouds and Apps [GEN3103]

Project Radium

VMware Project Radium

Last year VMware introduced vSphere Bitfusion which allow shared access to a pool of GPUs over a network. Project Radium expands the fetature set of Bitfusion to other architectures and will support AMD, Graphcore, Intel, Nvidia and other hardware vendors for AI/ML workloads.

VMworld 2021 session: Project Radium: Bringing Multi-Architecture compute to AI/ML workloads [VI1297]

Project IDEM

IDEM has been described as an “easy to use management automation technology”.

VMworld 2021 session: Solution Keynote: What’s Next? A Look inside VMware’s Innovation Engine [VI3091] and Next-Generation SaltStack: What Idem Brings to SaltStack [VI1865]

Please comment below or let me know via Twitter or LinkedIn if I missed a new or relevant VMware project. 😉

Must Watch VMworld Multi-Cloud Sessions

I recently wrote a short blog about some of the sessions I recommend to customers, partners and friends.

If you would like to know more about the VMware multi-cloud strategy and vision, have a look at some of the sessions below:

VMworld 2021 Must Watch Sessions


VMworld 2021 – My Content Catalog and Session Recommendation

VMworld 2021 – My Content Catalog and Session Recommendation

VMworld 2021 is going to happen from October 6-7, 2021 (EMEA). This year you can expect so many sessions and presentations about the options you have when combining different products together, that help you to reduce complexity, provide more automation and therefore create less overhead.

Let me share my 5 personal favorite picks and also 5 recommended sessions based on the conversations I had with multiple customers this year.

My 5 Personal Picks

10 Things You Need to Know About Project Monterey [MCL1833]

Project Monterey was announced in the VMworld 2020 keynote. There has been tremendous work done since then. Hear Niels Hagoort and Sudhansu Jain talking about SmartNICs and how they will redefine the data center with decoupled control and data planes – for ESXi hosts and bare-metal systems. They are going to cover and demo the overall architecture and use cases!

Upskill Your Workforce with Augmented and Virtual Reality and VMware [VI1596]

Learn from Matt Coppinger how augmented realited (AR) and virtual reality (VR) are transforming employee productivity, and how these solutions can be deployed and managed using VMware technologies. Matt is going to cover the top enterprise use cases for AR/VR as well as the challenges you might face deploying these emerging technologies. Are you interested how to architect and configure VMware technologies to deploy and manage the latest AR/VR technology, applications and content? If yes, then this session is also for you.

Addressing Malware and Advanced Threats in the Network [SEC2027] (Tech+ Pass Only)

I am very interested to learn more cybersecurity. With Chad Skipper VMware has an expert who can give insights on how the Network Detection and Response (NDR) capabilities if NSX Advanced Threat Prevention provide visibility, detection and prevention of advanced threats.

60 Minutes of Non-Uniform Memory Access (NUMA) 3rd Edition [MCL1853]

Learn more about NUMA from Frank Denneman. You are going to learn more about the underlying configuration of a virtual machine and discover the connection between the Generapl-Purpose Graphics Processing Unit (GPGPU) and the NUMA node. You will also understand after how your knowledge of NUMA concepts in your cluster can help the developer by aligning the Kubernetes nodes to the physical infrastructure with the help of VM Service.

Mount a Robust Defense in Depth Strategy Against Ransomware [SEC1287]

Are you interested to learn more about how to protect, detect, respond to and recover from cybersecurity attacks across all technology stacks, regardless of their purpose or location? Learn more from Amanda Blevins about the VMware solutions for end users, private clouds, public clouds and modern applications.

5 Recommended Sessions based on Customer Conversations

Cryptographic Agility: Preparing for Quantum Safety and Future Transition [VI1505]

A lot of work is needed to better understand cryptographic agility and how we can address and manage the expected challenges that come with quantum computing. Hear VMware’s engineers from the Advanced Technology Group talking about the requirements of crypto agility and VMware’s recent research work on post-quantum cryptography in the VMware Unified Access Gateway (UAG) project.

Edge Computing in the VMware Office of the CTO: Innovations on the Horizon [VI2484]

Let Chris Wolf give you some insight into VMware’s strategic direction in support of edge computing. He is going to talk about solutions that will drive down costs while accelerating the velocity and agility in which new apps and services can be delivered to the edge.

Delivering a Continuous Stream of More Secure Containers on Kubernetes [APP2574]

In this session one can see how you can use two capabilities in VMware Tanzu Advanced, Tanzu Build Service and Tanzu Application Catalog, to feed a continuous stream of patched and compliant containers into your continuous delivery (CD) system. A must attend session delivered by David Zendzian, the VMware Tanzu Global Field CISO.

A Modern Firewall For any Cloud and any Workload [SEC2688]

VMware NSX firewall reimagines East-West security by using a distributed- and software-based approach to attach security policies to every workload in any cloud. Chris Kruegel gives you insights on how to stop lateral movement with advanced threat prevention (ATP) capabilities via IDS/IPS, sandboxing, NTA and NDR.

A Practical Approach for End-to-End Zero Trust [SEC2733]

Hear different the VMware CTOs Shawn Bass, Pere Monclus and Scott Lundgren talking about a zero trust approach. Shawn and the others will discuss specific capabilities that will enable customers to achieve a zero trust architecture that is aligned to the NIST guidance and covers secure access for users as well secure access to workloads.

Enjoy VMworld 2021! 🙂